During my recent interactions with journalists and researchers, I have encountered a common misconception: They assume that examining blockchain transactions requires in-depth technical knowledge of coding and the blockchain. However, this assumption could not be further from the truth! It turns out there are a few easy-to-use and free tools available that can shed light on individual wallets, tokens, and the interaction networks of different wallets. Typically, I use two main tools when I want to follow the crypto: Etherscan and Bitquery’s blockchain explorer.
Today, I’m going to give a brief overview of each of these tools and provide examples. Follow along, and by the end of this tutorial you will be ready to perform your own investigations!
Using Etherscan to examine individual wallets
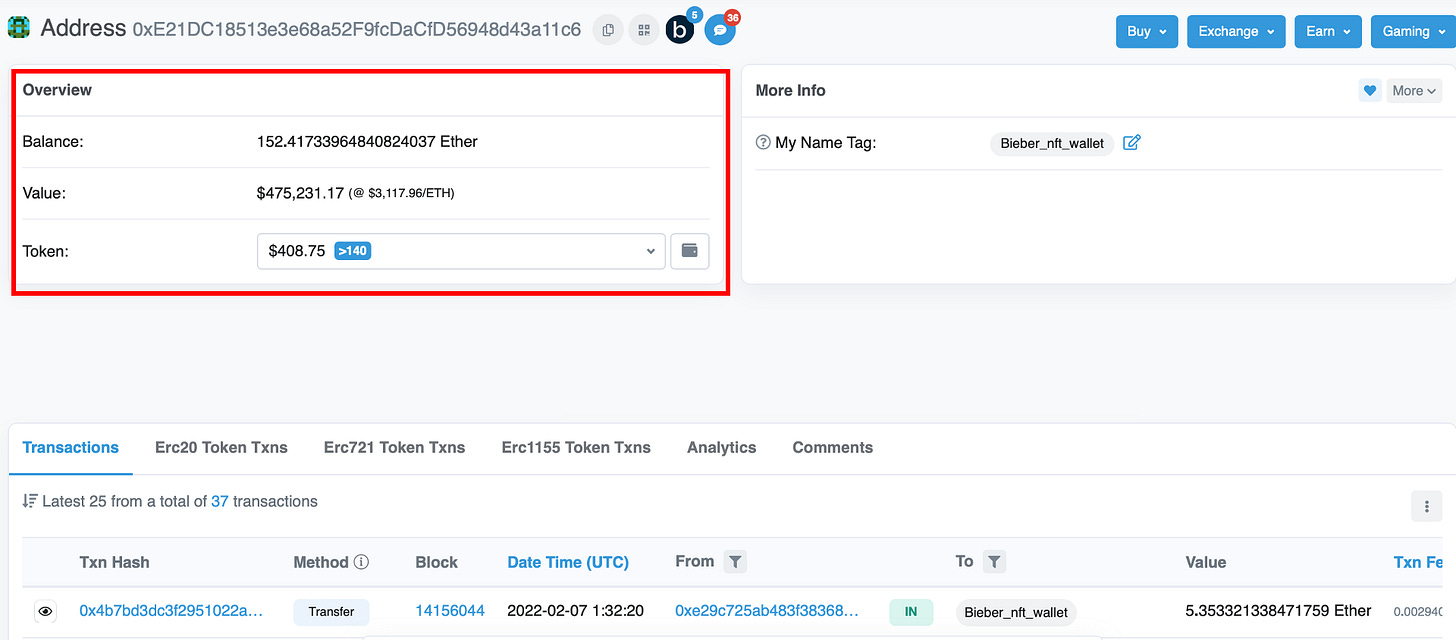
For practice, we will use Justin Bieber’s wallet. This link will take you to the Etherscan page for the wallet, which will look something like this:
I’ve used red boxes to point out the key features of Etherscan. First, the “Overview” section shows a summary of the wallet’s total Ethereum balance, the value of that balance in USD, and the total value of other tokens held in the wallet. Next to that section, the “My Name Tag” function allows you to create private labels for wallets you examine. This is a very helpful feature, particularly if you go crawling through hundreds of wallets like me! In this instance, you can see I’ve tagged this wallet as “Bieber_nft_wallet.”
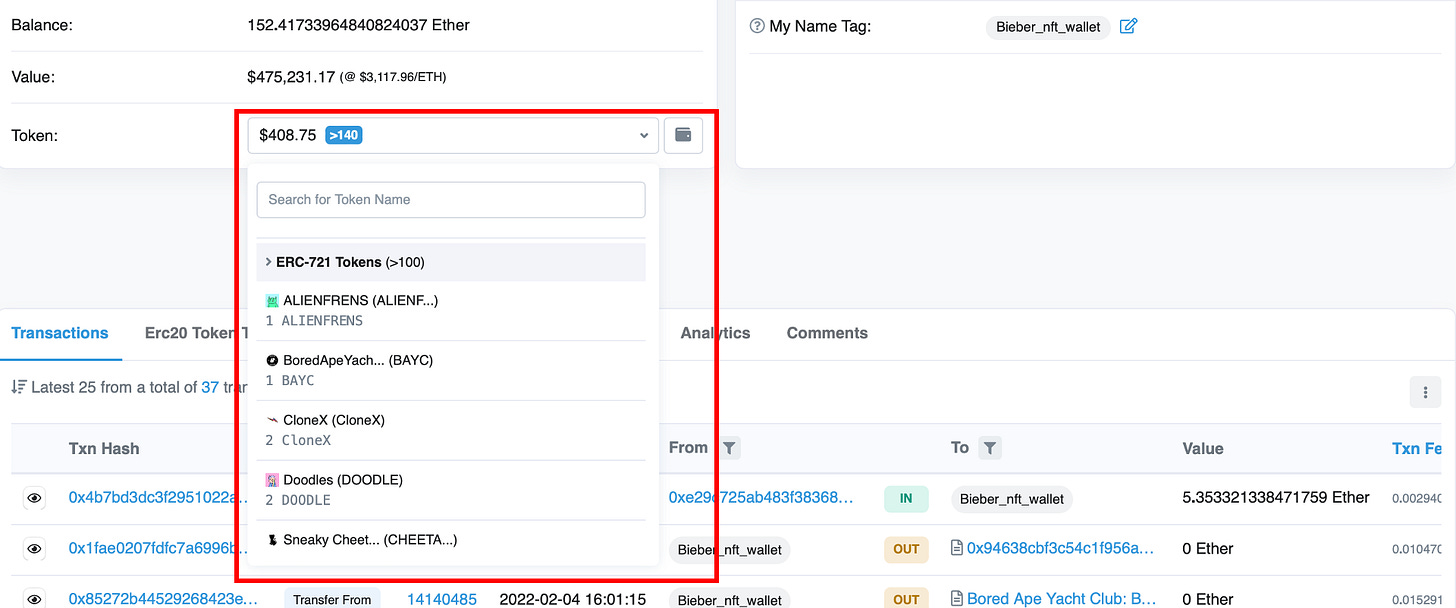
If you click on the drop-down menu, you will see a list of every token held in that wallet, categorized as ERC-20, ERC-721, and ERC-1155. ERC-20 is used to generate fungible tokens, while ERC-721 and -1155 are used for non-fungible tokens. Note that within these categories, you may see a bunch of tokens with no value. These are usually tokens that were airdropped into the wallet and can generally be ignored.
Next, let’s take a look at a transaction within Etherscan. By clicking on a hyperlink under “Txn Hash,” you can examine the specific features of every transaction the wallet has performed. Let’s click on the recent Ethereum transfer to Bieber’s wallet (starts with 0x4b7b…)
This gives us the essential details of the transaction, including when it happened, the involved wallets, and the value of the transaction. This example is a simple transfer between two wallets, and transactions can be much more complex. However, by viewing this window, you will be able to figure it out!
Next, we can return to the original page. Go to the “Token” drop-down menu shown above, scroll down to the ERC-721 section, and click on “Alienfrens.” This brings up a new window that shows all of the transactions between Bieber’s wallet involving Alienfrens NFTs. This technique works for any token in the drop-down menu, enabling you to examine all transactions for each token in question.
Using Etherscan to analyze tokens
In addition to examining wallets, Etherscan enables you to look at things from the perspective of different tokens. As an example, let’s take a look at Celsius Network’s CEL token. Type “Celsius” into the Etherscan search bar and scroll down to the CEL token address:
This opens a new page summarizing all transactions involving the token, all holders of the token, a description of the token, decentralized exchange (DEX) trades with the token, and the contract spelling out how the token is coded:
In particular, the “Holders” tab is quite useful, enabling you to figure out the token’s distribution and major owners of the token. In the case of CEL token, we observe that its ownership is highly concentrated in a few wallets and on the FTX exchange, with more than 80% of the total tokens held in only ten wallets:
Generating flow diagrams with Bitquery
Finally, it can be very helpful to use diagrams to get a “big picture” look at the network of interactions involving a particular wallet or token. Bitquery provides a free blockchain explorer to do exactly this at explorer.bitquery.io. This will take you to the explorer homepage. We can return to Justin Bieber to look at how crypto flows to and from his wallet. Copy his wallet address from etherscan into the explorer search bar. You should see something like this:
While I recommend playing with of the features offered by explorer, we will just focus on its ability to graph wallet interactions. Click on the “Money Flow” tab, which enables you to generate two different types of graphs (“Graph” and “Sankey”). While it is a matter of preference, I find the “Sankey” graph option generates the most useful diagrams. Click “Sankey.” (Note that you can generate graphs for any token in the wallet using the drop-down menu on the top left).
This graph shows us the flow of Ethereum into, and out of, Bieber’s wallet. We can change the “depth” settings to see more details about where the ethereum originated from, but the graph won’t change much. This is because the date is set by default to only include the last month of transactions. To get a complete picture of Bieber’s wallet, we can look back at Etherscan to identify when the wallet became active. The first transaction was 12/26/21, so let’s change our date parameters to go from the date of this initial transaction up to the present. Set depth for “inbound” to two":
Now we have a complete picture of Bieber’s wallet. We can see that the vast majority of income came from the InBetweeners NFT project. While not annotated here, the outflows from this wallet go to the Opensea NFT exchange.
While Bieber’s wallet is quite simple, these diagrams can get very complicated very quickly if you are examining an active wallet. However, at a minimum this graphing tool can provide a nice overview of how the wallet behaves and what other wallets it interacts with.
Other tips
In no particular order:
If you are looking at a wallet, it can be helpful to start by looking at the very first transactions made by the wallet. This gives you clues about who may have created it and provides a starting point for further research.
While the graphs generated by Explorer are quite helpful, they may not include all transactions. Internal transactions won’t be shown, and if a wallet has lots of different interacting wallets it may become too complex for the entire picture to be shown. In these instances, it can be helpful to go back to Etherscan and do the detailed analysis using Excel
For questions related to NFTs, it can be helpful to plug the wallet address into OpenSea.
For questions related to DeFi participation, I like to use zapper.fi
I hope this tutorial has been helpful. Good luck with your research!


Thanks so much
This is very helpful. Thank you.